To install this JSPWiki extension, you will need Admin rights; and have the Haddock Template activated.
 |
 library, a front-end chart generator, using Scalable Vector Graphics to render charts DPI independent.
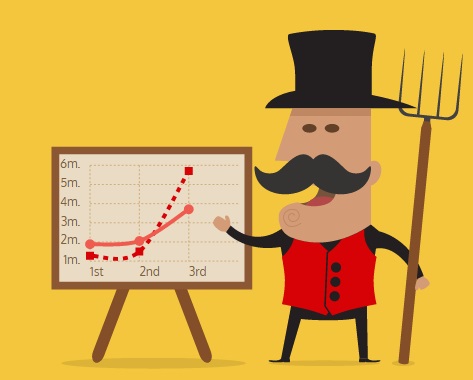
Chartist Behavior is a JSPWiki javascript extension which converts jspwiki tables to stunning line-charts, bar-charts, donut- and pie-charts.
Find below the installation instructions. See Chartist for how-to-use examples.
Step 1: Create JS file#
Create a javascript behavior file Chartist.js and put it in <your-wiki-site>/scripts. This script automatically pulls the library from the from jsDeliver Content delivery network at http://cdn.jsdelivr.net/chartist.js/latest
 .
.
!function(a,b,c,d){function i(a){var b="style".slick().inject(c).sheet;while(a[0])b.insertRule(a.pop(),0)}function h(a){var c=b.sliceArgs(a)[0]||"line",d=e(a,"span."+b+"-options"),h,i;c=c.capitalize(),c.match(/Line|Bar|Pie/)&&a.getElements("table").each(function(a){h=g(a),h&&(i=["div",["div.ct-chart.ct-golden-section"]].slick().inject(a,"after"),a.addClass(b+"-table"),c=="Pie"&&(h.series=h.series[0]),new Chartist[c](i.getFirst(),h,f(d,h.labels,h.series)))})}function g(a){var b=a.rows,c=b.length,d,e,f,g,h=undefined,i=[];for(d=0;d<c;d++){f=Array.from(b[d].cells),g=f.length;if(f[0].tagName.test(/TH/i)){h=[];for(e=0;e<g;e++)h[e]=f[e].innerHTML}else{for(e=0;e<g;e++)f[e]=+f[e].get("text");i.push(f)}}return i[0]?{labels:h,series:i}:null}function f(a,b,c){if(a!="")try{return Function("labels","series","return "+a)()}catch(d){console.log("Options eval err",d,a);return null}}function e(a,b){var c,d=new DocumentFragment;while((c=a.firstChild)&&c.nodeType==3)d.appendChild(c);d=d.textContent.trim(),d!=""&&b.slick({text:d}).inject(a,"top");return d}var j="[class^="+b+"]";a.once(j,function(){"link".slick({rel:"stylesheet",href:d+"css"}).inject(c),i([".chartist-options,.chartist-table{display:none;}",".ct-chart .ct-label,.ct-chart .ct-label.ct-vertical,.ct-chart .ct-label.ct-horizontal{font-size:1em;}",".ct-chart-pie .ct-label{fill:rgba(255,255,255,.8);}"]),"script".slick({src:d+"js",events:{load:function(b){a.add(j,h).update()} }}).inject(c)})}(Wiki,"chartist",document.head,"//cdn.jsdelivr.net/chartist.js/latest/chartist.min.");
Step 2: Update JSP files#
Add following lines to the <your-wiki-site>/templates/haddock/commonheader.jsp file.
<!-- existing line -->
<script async src="<wiki:Link format='url' jsp='scripts/haddock.js'/>"></script>
<!-- add this line -->
<script src="<wiki:Link format='url' jsp='scripts/Chartist.js'/>" ></script>
And do the same in the <your-wiki-site>/templates/reader/ViewTemplate.jsp.
You are now ready to add cool charts to your wiki-pages !
No need to restart your JSPWiki server.
Category.Haddock Behavior
.feather {
background-image:url( );
background-repeat:no-repeat;
background-position:top;
background-size:48px;
text-align:center;
}
 );
background-repeat:no-repeat;
background-position:top;
background-size:48px;
text-align:center;
}
Copyright © 2024 The Apache Software Foundation,
Licensed under the Apache License, Version 2.0 .
.
Apache and the Apache feather logo are trademarks of The Apache Software Foundation.
Licensed under the Apache License, Version 2.0
 .
.Apache and the Apache feather logo are trademarks of The Apache Software Foundation.